- Location Strategy Top 10 Chartbook
- Posts
- Location Strategy Chartbook 06.28.25
Location Strategy Chartbook 06.28.25
Real Estate Market Insights
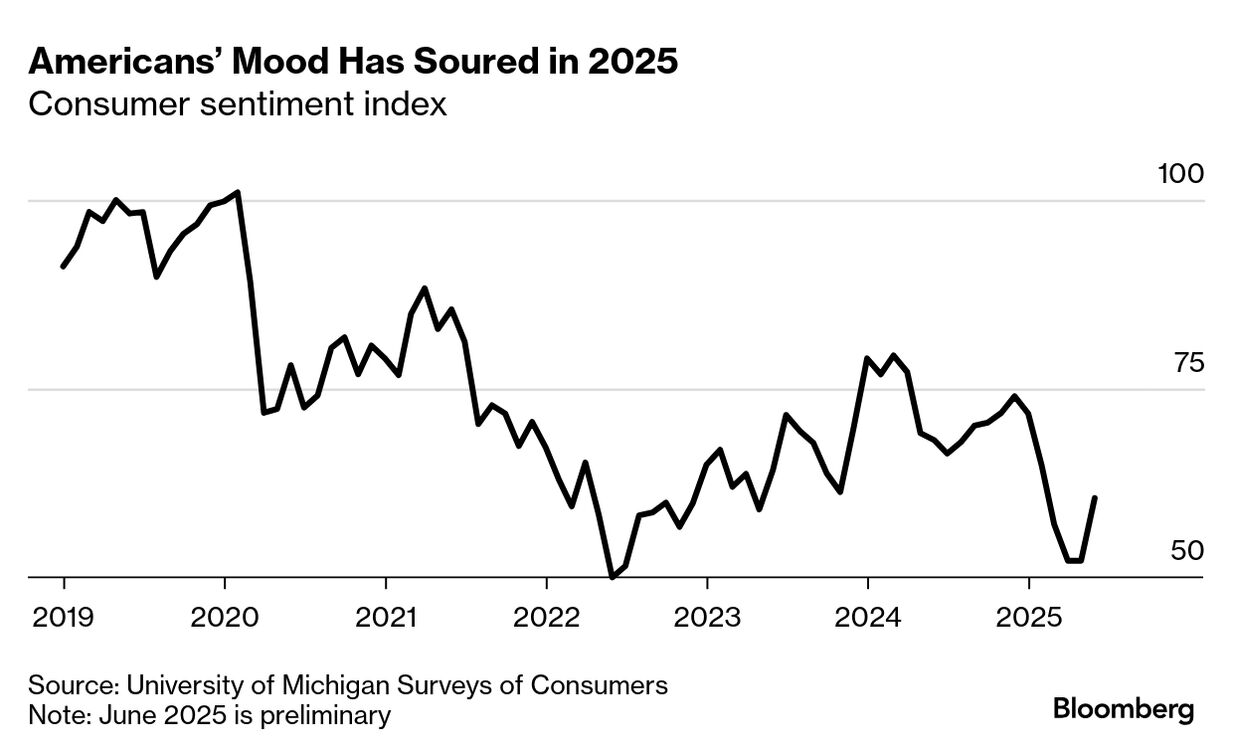
American consumers aren’t feeling great. They’ve been feeling bad about everything from prices to the stock market. They’ve felt so bad, in fact, that Michigan’s Index of Consumer Sentiment was stuck at one of its worst readings on record for two months this spring after plunging 29% in the first four months of 2025.
Over the 79 years of the survey, a drop this large this fast has almost always predicted a recession. Sentiment readings improved slightly at the start of June but still indicate Americans expect much higher prices and a much slower economy in the coming year.
It’s “dangerous to overlook” such negative consumer sentiment, says Joanne Hsu, the director of the University of Michigan’s Surveys of Consumers. But that’s exactly what Wall Street’s been doing: As so-called soft indicators remain low, hard economic data like jobs are mostly holding up. Stocks have roared back from April lows.
The survey is rarely wrong. In 1974, for instance, it spotted the worst recession since World War II, while ever-rising sales of TVs, cars and other consumer goods were tricking economists into thinking things were fine.
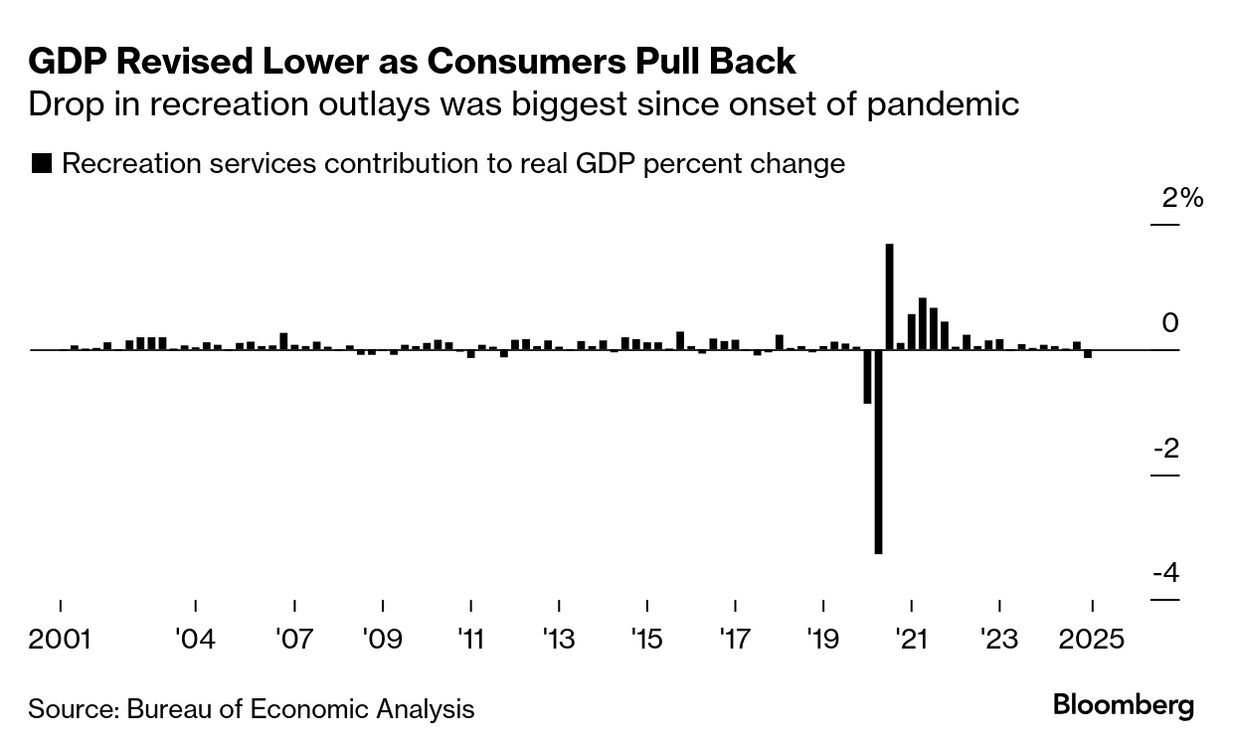
While investors continue to go wild, pushing stock indexes to new records, US consumer spending grew at its weakest pace since the onset of the Covid-19 pandemic on a sharp deceleration in outlays for a variety of services. Spending on services contributed 0.3 percentage point to gross domestic product in the first three months of the year, the least since the second quarter of 2020. That was down sharply from a previously reported 0.79 point boost. Overall consumer spending increased at a 0.5% pace, instead of the previously reported 1.2%. GDP declined at a downwardly revised 0.5% annualized rate in the first quarter as a result. The numbers indicate the economy’s woes early in the year weren’t entirely related to the deterioration in the trade balance related to the Trump administration’s tariffs. There’s likely more at work.
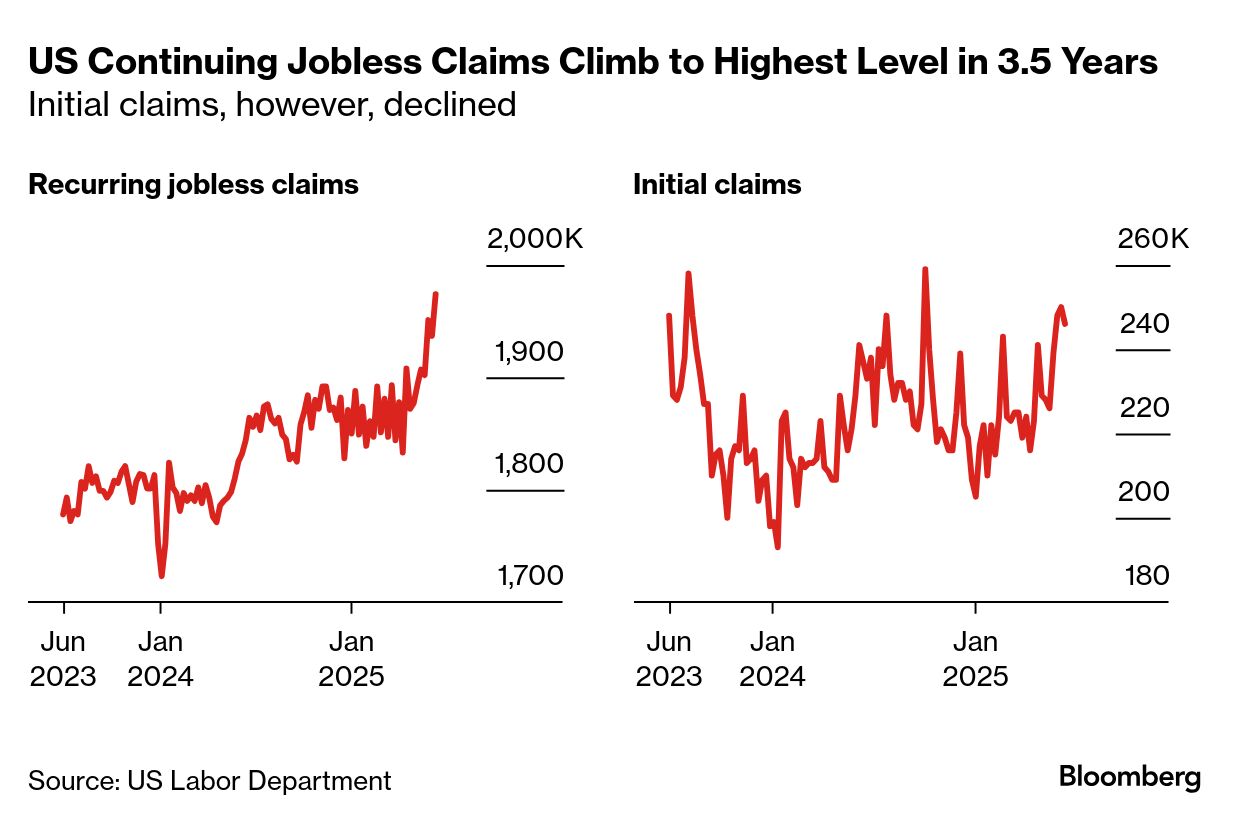
Recurring applications for US unemployment benefits rose to the highest since November 2021, extending a sharp increase over the past month and a half, and signaling more people are staying out of work for longer. Continuing claims, a proxy for the number of people receiving benefits, increased to 1.97 million in the week ended June 14. That was above all estimates in a Bloomberg survey. Initial claims, however, decreased, to 236,000 in the week ended June 21, lower than economists anticipated. And the four-week moving average of new applications, a metric that helps smooth out volatility, also dipped.
WSJ: Another sign of deterioration comes courtesy of outplacement firm Challenger, Gray & Christmas. It reported earlier this month that, through May, U.S. employers had announced 80% more job cuts than the same period in 2024.
In May, Challenger said the weakness spread to two bellwethers: services like cleaning staff and to retail workers.
The most closely watched labor number is “U-3” or the headline unemployment rate, due a week from today. Even if June’s number ticks up slightly to 4.3% (versus 3.6% a year ago and 4.2% in May), as some expect, that doesn’t scream “recession.” But sometimes even modest moves higher whisper it.
Unemployment typically only begins to rise shortly before a recession begins and peaks a bit after it ends. However, stocks move faster to anticipate changes in the economy, both on the downside and the upside, and usually bounce before a downturn is over. So monthly jobs figures shift too late to tell investors when to become cautious or to raise their risk appetite.
Jobless claims and layoffs, on the other hand, are noisy, but they can be a more effective signal of turning points.

Property (auto and housing) insurance payment growth slowed in the year through May 2025, according to Bank of America internal data. But median payments still rose 6% year-over-year (YoY) and by over 40% since the period June 2020-May 2021.
This has taken household property insurance payments as a percentage of income up to 5%.
There is a slight skew in payment growth towards younger generations, who may be at a life-stage where they need more living space and larger vehicles. Meanwhile, from a geographic perspective, most states have seen broadly similar rises in property insurance payments, though it appears the increases in Texas and Washington have been slightly larger, while New Jersey and Michigan have seen smaller ones.

Over the past few years, the US labor market has been strong, with robust job growth and relatively healthy increases in wages and salaries, as mentioned in our June Consumer Checkpoint. This has meant that rising household income has helped cover the growth in property insurance payments – but not totally. Exhibit 3 shows that in Bank of America internal data, the median annual property insurance payment has risen from just over 4% as a percentage of total household income in June 2020-May 2021 to around 5% in June 2024-May 2025. It is not a surprise, perhaps, that younger generations have seen the largest property insurance payment increase (Exhibit 4). These younger groups, especially Gen Z and Millennials, may be at a stage in their life where they need more space, leading them to buy bigger and more expensive homes and vehicles. But it is noteworthy, in our view, that even Gen X has seen a rise in property insurance payments of 45% relative to June 2020-May 2021.

The median annual property insurance payment varies widely across US states. Looking at Bank of America internal data, we find households in Illinois, North Carolina and Oregon had the lowest annual property insurance payments relative to the US median in the year through May 2025, with payments at least 15% below the US median. At the other end of the spectrum, households in Georgia, Texas, and Michigan had the highest, with payments at least 7% higher than the US median.

For auto insurance, the consumer price index (CPI) measure of motor vehicle insurance from the Bureau of Labor Statistics (BLS) shows the year-over-year (YoY) rate of growth at 7% in May 2025, easing from a peak of 23% YoY in April 2024. So while still high, at least the trajectory points to some easing in upward premium pressures.

Austin’s medical office sector remains on solid footing, supported by one of the fastest-growing populations in the country. The Austin metropolitan area ranked third nationally in population growth last year, increasing by 2.3% according to the latest U.S. Census Bureau data.
This stability stands in stark contrast to Austin’s non-medical office sector, where the vacancy rate has climbed nine percentage points since early 2020 to approximately 18%, one of the highest in the country. The traditional office market has been hit hard by speculative development and declining occupancy, with nearly 370,000 square feet vacated in the first half of 2025 due to sluggish job growth and lower office attendance.
According to Will Stewart, senior vice president of Transwestern’s Healthcare Advisory Services Group, medical office development was largely overlooked during the latest development cycle. While developers focused on industrial, multifamily and traditional office, the medical office sector did not get the same focus. He noted that the supply of quality medical office buildings has not been able to keep up with the demand.

In Orange County, CA’s supply-constrained market, where industrial space is scarce and retail demand remains stable, the most expensive retail property sale of the past year shows one investor is betting on both.
Terreno Realty Corp. has acquired a 134,000-square-foot property leased to The Home Depot in Santa Ana for $49.5 million, the company said. The site at 3500 West MacArthur Blvd is being used as a store but sits on 12.1 acres of industrial-zoned land with logistics-friendly infrastructure. The deal reflects Terreno’s dual bet on long-term retail income and potential future industrial repositioning.
Santa Ana’s retail market has lagged the broader county, with recent store closures outpacing openings, yet vacancy remains low at 5.4%, according to CoStar data. The Home Depot has outperformed sector trends, logging 9.5% year-over-year sales growth in the fourth quarter of 2024 and projecting another 2.8% increase in 2025.
Terreno’s strategy focuses on acquiring infill industrial real estate in high-barrier, coastal U.S. cities. The New York-based real estate investment trust earlier this month acquired a 34,000-square-foot industrial flex building near LAX for $10 million, and in May, it sold a 545,000-square-foot Commerce, California property for $97 million, netting a 9.5% internal rate of return since acquiring it in 2012, according to the firm.
Terreno targets six major markets: Los Angeles, New York/New Jersey, San Francisco, Seattle, Miami and Washington, D.C.—all of which face limited supply and strong tenant demand for logistics infrastructure.
Kimco Realty, a retail-focused REIT that has been reshaping its portfolio, was the seller, according to CoStar data. The company sold two land parcels and one shopping center for $41.3 million in the first quarter.

"I believe that there are [builder] customers that are overpaying for the home to effectively get an incentive... They may potentially be upside down when they try to sell that home," says KB Home COO Rob McGibney.
Speaking to analysts on Tuesday, KB Home—which prefers outright home price cuts over incentives—said that some buyers turning to some of their competitors are effectively overpaying for new builds just to get rate buydowns, and if they need to sell in the immediate future, they might not be able to fetch the artificially high base price they paid.
KB Home says the 2025 housing market is softer than they expected
“The actions we began to take late in our 2025 first quarter, evaluating base pricing in every community relative to local market conditions, then repositioning our communities with a focus on offering the most compelling value, led to strong net orders in March. However, our net orders declined in April and May, which did not follow the typical spring trajectory. As a result, even though our average community count was in line with our projection, and our cancellation rate was fairly steady, our monthly absorption pace per community was 4.5 net orders compared to 5.5 in last year's second quarter. While our net order pace was below our internal goal, we believe it ranks high among the large production homebuilders.” McGibney said on their June 23, 2025 earnings call

There are now over 500k new homes for sale in the US, the most since November 2007.

In May there were 9.8 months of inventory, highest since 2022. Prior to 2022, when supply was this high the US economy was always in recession & facing job losses.
